Dec 17, 2025·7 min
PostgreSQL connection pooling: app pooling vs PgBouncer
PostgreSQL connection pooling: compare app pools and PgBouncer for Go backends, metrics to monitor, and misconfigs that trigger latency spikes.
PostgreSQL connection pooling: compare app pools and PgBouncer for Go backends, metrics to monitor, and misconfigs that trigger latency spikes.
A database connection is like a phone line between your app and Postgres. Opening one costs time and work on both sides: TCP/TLS setup, authentication, memory, and a backend process on the Postgres side. A connection pool keeps a small set of these “phone lines” open so your app can reuse them instead of dialing again for every request.
When pooling is off or mis-sized, you rarely get a neat error first. You get random slowness. Requests that usually take 20-50 ms suddenly take 500 ms or 5 seconds, and p95 shoots up. Then timeouts show up, followed by “too many connections,” or a queue inside your app while it waits for a free connection.
Connection limits matter even for small apps because traffic is bursty. A marketing email, a cron job, or a few slow endpoints can cause dozens of requests to hit the database at once. If each request opens a fresh connection, Postgres can spend a lot of its capacity just accepting and managing connections instead of running queries. If you already have a pool but it’s too large, you can overload Postgres with too many active backends and trigger context switching and memory pressure.
Watch for early symptoms like:
Pooling reduces connection churn and helps Postgres handle bursts. It won’t fix slow SQL. If a query is doing a full table scan or waiting on locks, pooling mostly changes how the system fails (queueing sooner, timeouts later), not whether it’s fast.
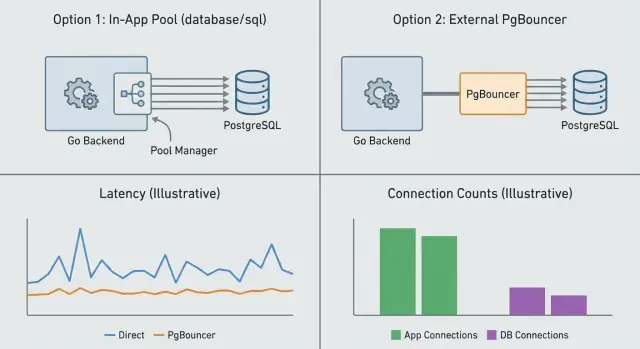
Connection pooling is about controlling how many database connections exist at once and how they get reused. You can do this inside your app (app-level pooling) or with a separate service in front of Postgres (PgBouncer). They solve related but different problems.
App-level pooling (in Go, usually the built-in database/sql pool) manages connections per process. It decides when to open a new connection, when to reuse one, and when to close idle ones. This avoids paying the setup cost on every request. What it can’t do is coordinate across multiple app instances. If you run 10 replicas, you effectively have 10 separate pools.
PgBouncer sits between your app and Postgres and pools on behalf of many clients. It’s most useful when you have lots of short-lived requests, many app instances, or spiky traffic. It caps server-side connections to Postgres even if hundreds of client connections arrive at once.
A simple division of responsibilities:
They can work together without “double pooling” problems as long as each layer has a clear purpose: a sane database/sql pool per Go process, plus PgBouncer to enforce a global connection budget.
A common confusion is thinking “more pools means more capacity.” Usually it means the opposite. If every service, worker, and replica has its own large pool, the total connection count can explode and cause queueing, context switching, and sudden latency spikes.
database/sql pooling really behavesIn Go, sql.DB is a connection pool manager, not a single connection. When you call db.Query or db.Exec, database/sql tries to reuse an idle connection. If it can’t, it may open a new one (up to your limit) or make the request wait.
That wait is where “mystery latency” often comes from. When the pool is saturated, requests queue inside your app. From the outside, it looks like Postgres got slow, but the time is actually spent waiting for a free connection.
Most tuning comes down to four settings:
MaxOpenConns: hard cap on open connections (idle + in use). When you hit it, callers block.MaxIdleConns: how many connections can sit ready for reuse. Too low causes frequent reconnects.ConnMaxLifetime: forces periodic connection recycling. Helpful for load balancers and NAT timeouts, but too low causes churn.ConnMaxIdleTime: closes connections that sit unused for too long.Connection reuse usually lowers latency and database CPU because you avoid repeated setup (TCP/TLS, auth, session init). But an oversized pool can do the opposite: it allows more concurrent queries than Postgres can handle well, increasing contention and overhead.
Think in totals, not per process. If each Go instance allows 50 open connections and you scale to 20 instances, you’ve effectively allowed 1,000 connections. Compare that number with what your Postgres server can actually run smoothly.
A practical starting point is to tie MaxOpenConns to expected concurrency per instance, then validate with pool metrics (in-use, idle, and wait time) before raising it.
PgBouncer is a small proxy between your app and PostgreSQL. Your service connects to PgBouncer, and PgBouncer holds a limited number of real server connections to Postgres. During spikes, PgBouncer queues client work instead of immediately creating more Postgres backends. That queue can be the difference between a controlled slowdown and a database that tips over.
PgBouncer has three pooling modes:
Session pooling behaves most like direct connections to Postgres. It’s the least surprising, but it saves fewer server connections during bursty load.
For typical Go HTTP APIs, transaction pooling is often a strong default. Most requests do a small query or a short transaction, then they’re done. Transaction pooling lets many client connections share a smaller Postgres connection budget.
The tradeoff is session state. In transaction mode, anything that assumes a single server connection stays pinned can break or behave oddly, including:
SET, SET ROLE, search_path)If your app relies on that kind of state, session pooling is safer. Statement pooling is the most restrictive and rarely fits web apps.
A useful rule: if each request can set up what it needs inside one transaction, transaction pooling tends to keep latency steadier under load. If you need long-lived session behavior, use session pooling and focus on stricter limits in the app.
If you run a Go service with database/sql, you already have app-side pooling. For many teams, that’s enough: a few instances, steady traffic, and queries that aren’t extremely spiky. In that setup, the simplest and safest choice is to tune the Go pool, keep the database connection limit realistic, and stop there.
PgBouncer helps most when the database is getting hit by too many client connections at once. This shows up with many app instances (or serverless-style scaling), bursty traffic, and lots of short queries.
PgBouncer can also hurt if it’s used in the wrong mode. If your code depends on session state (temporary tables, prepared statements kept across requests, advisory locks held across calls, or session-level settings), transaction pooling can cause confusing failures. If you truly need session behavior, use session pooling or skip PgBouncer and size app pools carefully.
Use this rule of thumb:
Connection limits are a budget. If you spend it all at once, every new request waits and tail latency jumps. The goal is to cap concurrency in a controlled way while keeping throughput steady.
Measure today’s peaks and tail latency. Record peak active connections (not averages), plus p50/p95/p99 for requests and key queries. Note any connection errors or timeouts.
Set a safe Postgres connection budget for the app. Start from max_connections and subtract headroom for admin access, migrations, background jobs, and spikes. If multiple services share the database, split the budget intentionally.
Map the budget to Go limits per instance. Divide the app budget by the number of instances and set MaxOpenConns to that (or slightly lower). Set MaxIdleConns high enough to avoid constant reconnects, and set lifetimes so connections recycle occasionally without churning.
Add PgBouncer only if you need it, and pick a mode. Use session pooling if you need session state. Use transaction pooling when you want the biggest reduction in server connections and your app is compatible.
Roll out gradually and compare before and after. Change one thing at a time, canary it, then compare tail latency, pool wait time, and database CPU.
Example: if Postgres can safely give your service 200 connections and you run 10 Go instances, start with MaxOpenConns=15-18 per instance. That leaves room for bursts and reduces the odds that every instance hits the ceiling at the same time.
Pooling problems rarely show up first as “too many connections.” More often, you see a slow rise in wait time and then a sudden jump in p95 and p99.
Start with what your Go app reports. With database/sql, monitor open connections, in-use, idle, wait count, and wait time. If wait count rises while traffic is flat, your pool is undersized or connections are being held too long.
On the database side, track active connections vs max, CPU, and lock activity. If CPU is low but latency is high, it’s often queueing or locks, not raw compute.
If you run PgBouncer, add a third view: client connections, server connections to Postgres, and queue depth. A growing queue with stable server connections is a clear sign the budget is saturated.
Good alert signals:
Pooling issues often appear during bursts: requests pile up waiting for a connection, then everything looks fine again. The root cause is often a setting that’s reasonable on one instance but dangerous once you run many copies of the service.
Common causes:
MaxOpenConns set per instance without a global budget. 100 connections per instance across 20 instances is 2,000 potential connections.ConnMaxLifetime / ConnMaxIdleTime set too low. This can trigger reconnect storms when many connections recycle at once.A simple way to reduce spikes is to treat pooling as a shared limit, not an app-local default: cap total connections across all instances, keep a modest idle pool, and use lifetimes long enough to avoid synchronized reconnects.
When traffic surges, you usually see one of three outcomes: requests queue up waiting for a free connection, requests time out, or everything slows down so much that retries pile on.
Queueing is the sneaky one. Your handler is still running, but it’s parked waiting for a connection. That wait becomes part of the response time, so a small pool can turn a 50 ms query into a multi-second endpoint under load.
A helpful mental model: if your pool has 30 usable connections and you suddenly have 300 concurrent requests that all need the database, 270 of them must wait. If each request holds a connection for 100 ms, tail latency quickly jumps into seconds.
Set a clear timeout budget and stick to it. The app timeout should be slightly shorter than the database timeout so you fail fast and reduce pressure instead of letting work hang.
statement_timeout so one bad query can’t hog connectionsThen add backpressure so you don’t overload the pool in the first place. Pick one or two predictable mechanisms, such as limiting concurrency per endpoint, shedding load with clear errors (like 429), or separating background jobs from user traffic.
Finally, fix slow queries first. Under pooling pressure, slow queries hold connections longer, which increases waits, which increases timeouts, which triggers retries. That feedback loop is how “a little slow” turns into “everything is slow.”
Treat load testing as a way to validate your connection budget, not just throughput. The goal is to confirm that pooling behaves under pressure the same way it does in staging.
Test with realistic traffic: the same request mix, burst patterns, and the same number of app instances you run in production. “One endpoint” benchmarks often hide pool problems until launch day.
Include a warm-up so you don’t measure cold caches and ramp-up effects. Let pools reach their normal size, then start recording numbers.
If you’re comparing strategies, keep the workload identical and run:
database/sql, no PgBouncer)After each run, record a small scorecard you can reuse after every release:
Over time, this turns capacity planning into something repeatable instead of guesswork.
Before you touch pool sizes, write down one number: your connection budget. That’s the maximum safe number of active Postgres connections for this environment (dev, staging, prod), including background jobs and admin access. If you can’t name it, you’re guessing.
A quick checklist:
MaxOpenConns) fits the budget (or the PgBouncer cap).max_connections and any reserved connections line up with your plan.Rollout plan that keeps rollback easy:
If you’re building and hosting a Go + PostgreSQL app on Koder.ai (koder.ai), Planning Mode can help you map the change and what you’ll measure, and snapshots plus rollback make it easier to revert if tail latency gets worse.
Next step: add one measurement before the next traffic jump. “Time spent waiting for a connection” in the app is often the most useful, because it shows pooling pressure before users feel it.
A pool keeps a small set of PostgreSQL connections open and reuses them across requests. This avoids paying the setup cost (TCP/TLS, auth, backend process setup) over and over, which helps keep tail latency steady during bursts.
When the pool is saturated, requests wait inside your app for a free connection, and that wait time shows up as slow responses. This often looks like “random slowness” because averages can stay fine while p95/p99 jump during traffic bursts.
No, it mostly changes how the system behaves under load by reducing reconnect churn and controlling concurrency. If a query is slow because of scans, locks, or poor indexing, pooling can’t make it fast; it can only limit how many slow queries run at once.
App pooling manages connections per process, so each app instance has its own pool and its own limits. PgBouncer sits in front of Postgres and enforces a global connection budget across many clients, which is especially useful when you have many replicas or spiky traffic.
If you run a small number of instances and your total open connections stay comfortably under the database limit, tuning Go’s database/sql pool is usually enough. Add PgBouncer when many instances, autoscaling, or bursty traffic could push total connections beyond what Postgres can handle smoothly.
A good default is to set a total connection budget for the service, then divide it by the number of app instances and set MaxOpenConns slightly below that per instance. Start small, watch wait time and p95/p99, and only increase if you’re sure the database has headroom.
Transaction pooling is often a strong default for typical HTTP APIs because it lets many client connections share fewer server connections and stays stable during bursts. Use session pooling if your code relies on session state persisting across statements, such as temp tables, session settings, or prepared statements reused across requests.
Prepared statements, temp tables, advisory locks, and session-level settings can behave differently because a client may not get the same server connection next time. If you need those features, either keep everything within a single transaction per request or switch to session pooling to avoid confusing failures.
Watch p95/p99 latency alongside app pool wait time, because wait time often rises before users complain. On Postgres, track active connections, CPU, and locks; on PgBouncer, track client connections, server connections, and queue depth to see if you’re saturating your connection budget.
First, stop unlimited waiting by setting request deadlines and a DB statement timeout so one slow query can’t hold connections forever. Then add backpressure by limiting concurrency for DB-heavy endpoints or shedding load, and reduce connection churn by avoiding overly short connection lifetimes that cause reconnect storms.